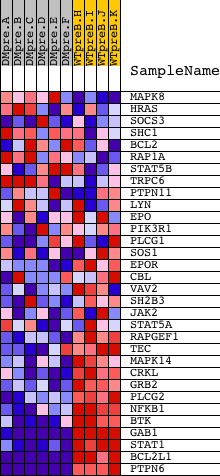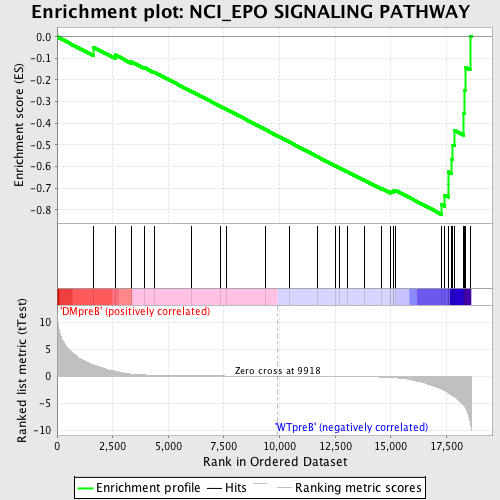
Profile of the Running ES Score & Positions of GeneSet Members on the Rank Ordered List
| Dataset | Set_04_DMpreB_versus_WTpreB.phenotype_DMpreB_versus_WTpreB.cls #DMpreB_versus_WTpreB |
| Phenotype | phenotype_DMpreB_versus_WTpreB.cls#DMpreB_versus_WTpreB |
| Upregulated in class | WTpreB |
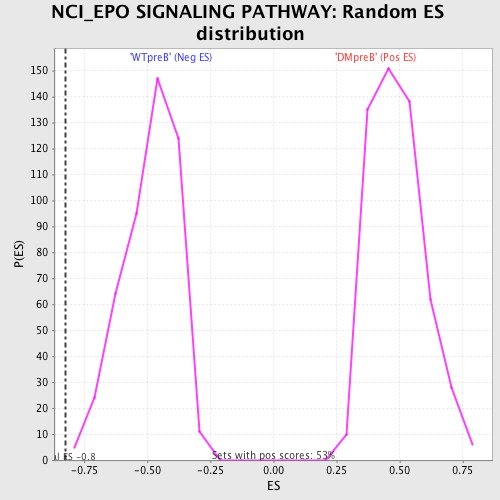
| GeneSet | NCI_EPO SIGNALING PATHWAY |
| Enrichment Score (ES) | -0.822034 |
| Normalized Enrichment Score (NES) | -1.6949439 |
| Nominal p-value | 0.0021276595 |
| FDR q-value | 0.01068439 |
| FWER p-Value | 0.12 |
| PROBE | DESCRIPTION (from dataset) | GENE SYMBOL | GENE_TITLE | RANK IN GENE LIST | RANK METRIC SCORE | RUNNING ES | CORE ENRICHMENT | |
|---|---|---|---|---|---|---|---|---|
| 1 | MAPK8 | 6459 | 1644 | 2.061 | -0.0492 | No | ||
| 2 | HRAS | 4868 | 2610 | 0.906 | -0.0838 | No | ||
| 3 | SOCS3 | 20131 | 3325 | 0.381 | -0.1150 | No | ||
| 4 | SHC1 | 9813 9812 5430 | 3936 | 0.225 | -0.1435 | No | ||
| 5 | BCL2 | 8651 3928 13864 4435 981 4062 13863 4027 | 4380 | 0.162 | -0.1643 | No | ||
| 6 | RAP1A | 8467 | 6027 | 0.066 | -0.2516 | No | ||
| 7 | STAT5B | 20222 | 7325 | 0.036 | -0.3207 | No | ||
| 8 | TRPC6 | 19565 | 7599 | 0.031 | -0.3348 | No | ||
| 9 | PTPN11 | 5326 16391 9660 | 9360 | 0.007 | -0.4293 | No | ||
| 10 | LYN | 16281 | 10463 | -0.007 | -0.4885 | No | ||
| 11 | EPO | 8911 | 11716 | -0.025 | -0.5554 | No | ||
| 12 | PIK3R1 | 3170 | 12502 | -0.041 | -0.5968 | No | ||
| 13 | PLCG1 | 14753 | 12675 | -0.046 | -0.6052 | No | ||
| 14 | SOS1 | 5476 | 13046 | -0.056 | -0.6241 | No | ||
| 15 | EPOR | 19204 | 13811 | -0.089 | -0.6635 | No | ||
| 16 | CBL | 19154 | 14602 | -0.166 | -0.7028 | No | ||
| 17 | VAV2 | 5848 2670 | 14978 | -0.236 | -0.7185 | No | ||
| 18 | SH2B3 | 5001 16383 | 15004 | -0.240 | -0.7153 | No | ||
| 19 | JAK2 | 23893 9197 3706 | 15111 | -0.267 | -0.7159 | No | ||
| 20 | STAT5A | 20664 | 15113 | -0.268 | -0.7108 | No | ||
| 21 | RAPGEF1 | 4218 2860 | 15230 | -0.297 | -0.7114 | No | ||
| 22 | TEC | 16514 | 17287 | -2.394 | -0.7764 | Yes | ||
| 23 | MAPK14 | 23313 | 17421 | -2.682 | -0.7324 | Yes | ||
| 24 | CRKL | 4560 | 17588 | -3.053 | -0.6832 | Yes | ||
| 25 | GRB2 | 20149 | 17590 | -3.055 | -0.6250 | Yes | ||
| 26 | PLCG2 | 18453 | 17743 | -3.480 | -0.5668 | Yes | ||
| 27 | NFKB1 | 15160 | 17789 | -3.591 | -0.5008 | Yes | ||
| 28 | BTK | 24061 | 17851 | -3.733 | -0.4329 | Yes | ||
| 29 | GAB1 | 18828 | 18283 | -5.430 | -0.3526 | Yes | ||
| 30 | STAT1 | 3936 5524 | 18294 | -5.505 | -0.2483 | Yes | ||
| 31 | BCL2L1 | 4440 2930 8652 | 18337 | -5.711 | -0.1416 | Yes | ||
| 32 | PTPN6 | 17002 | 18561 | -8.216 | 0.0030 | Yes |